Gold prices soared during the worst days of the health crisis, but have fallen back recently.
What are the factors that could push the price in either direction?
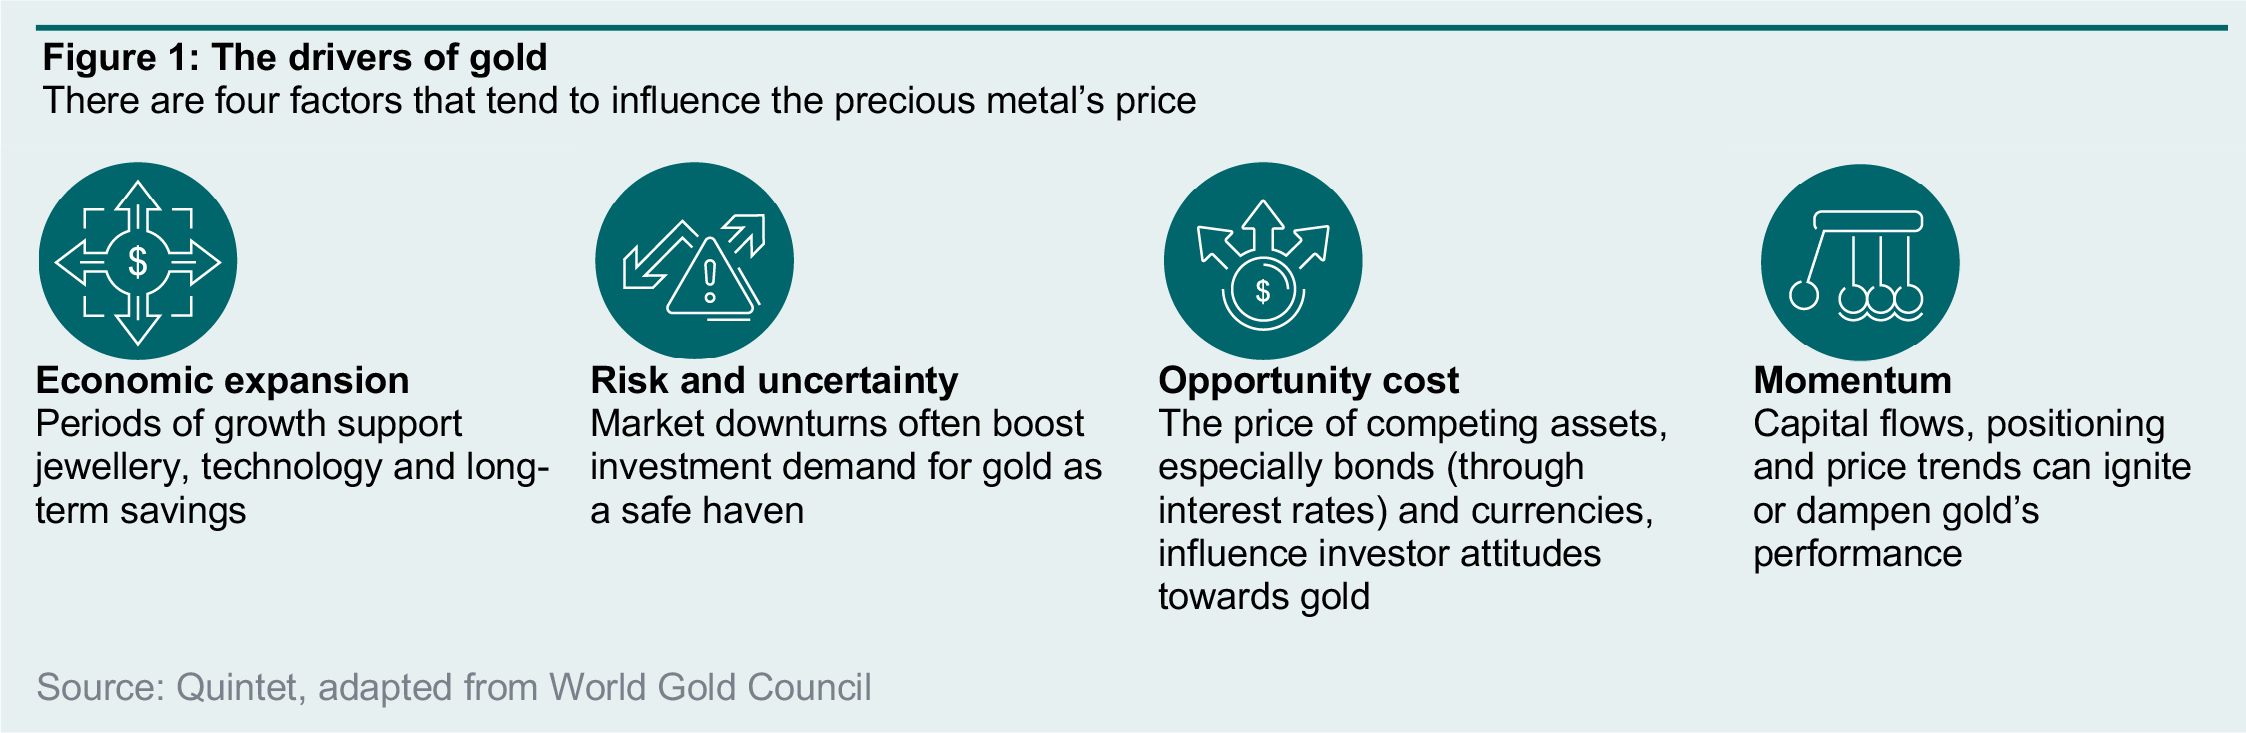
Typical valuation frameworks don’t apply to gold. Without a coupon or dividend, discounted cash flow models can’t be built. There are no expected earnings or book-to-value ratios either. Conceptually, four drivers explain fluctuations in gold prices (figure 1). First, periods of economic growth tend to raise gold demand for jewellery, technology and savings. Second, bouts of uncertainty often boost demand for gold as a safe-haven investment, for diversification and hedging. Third, the opportunity cost of holding competing assets is a key determinant. Fourth, capital flows and positioning have an impact too, by amplifying or dampening the momentum in gold prices.
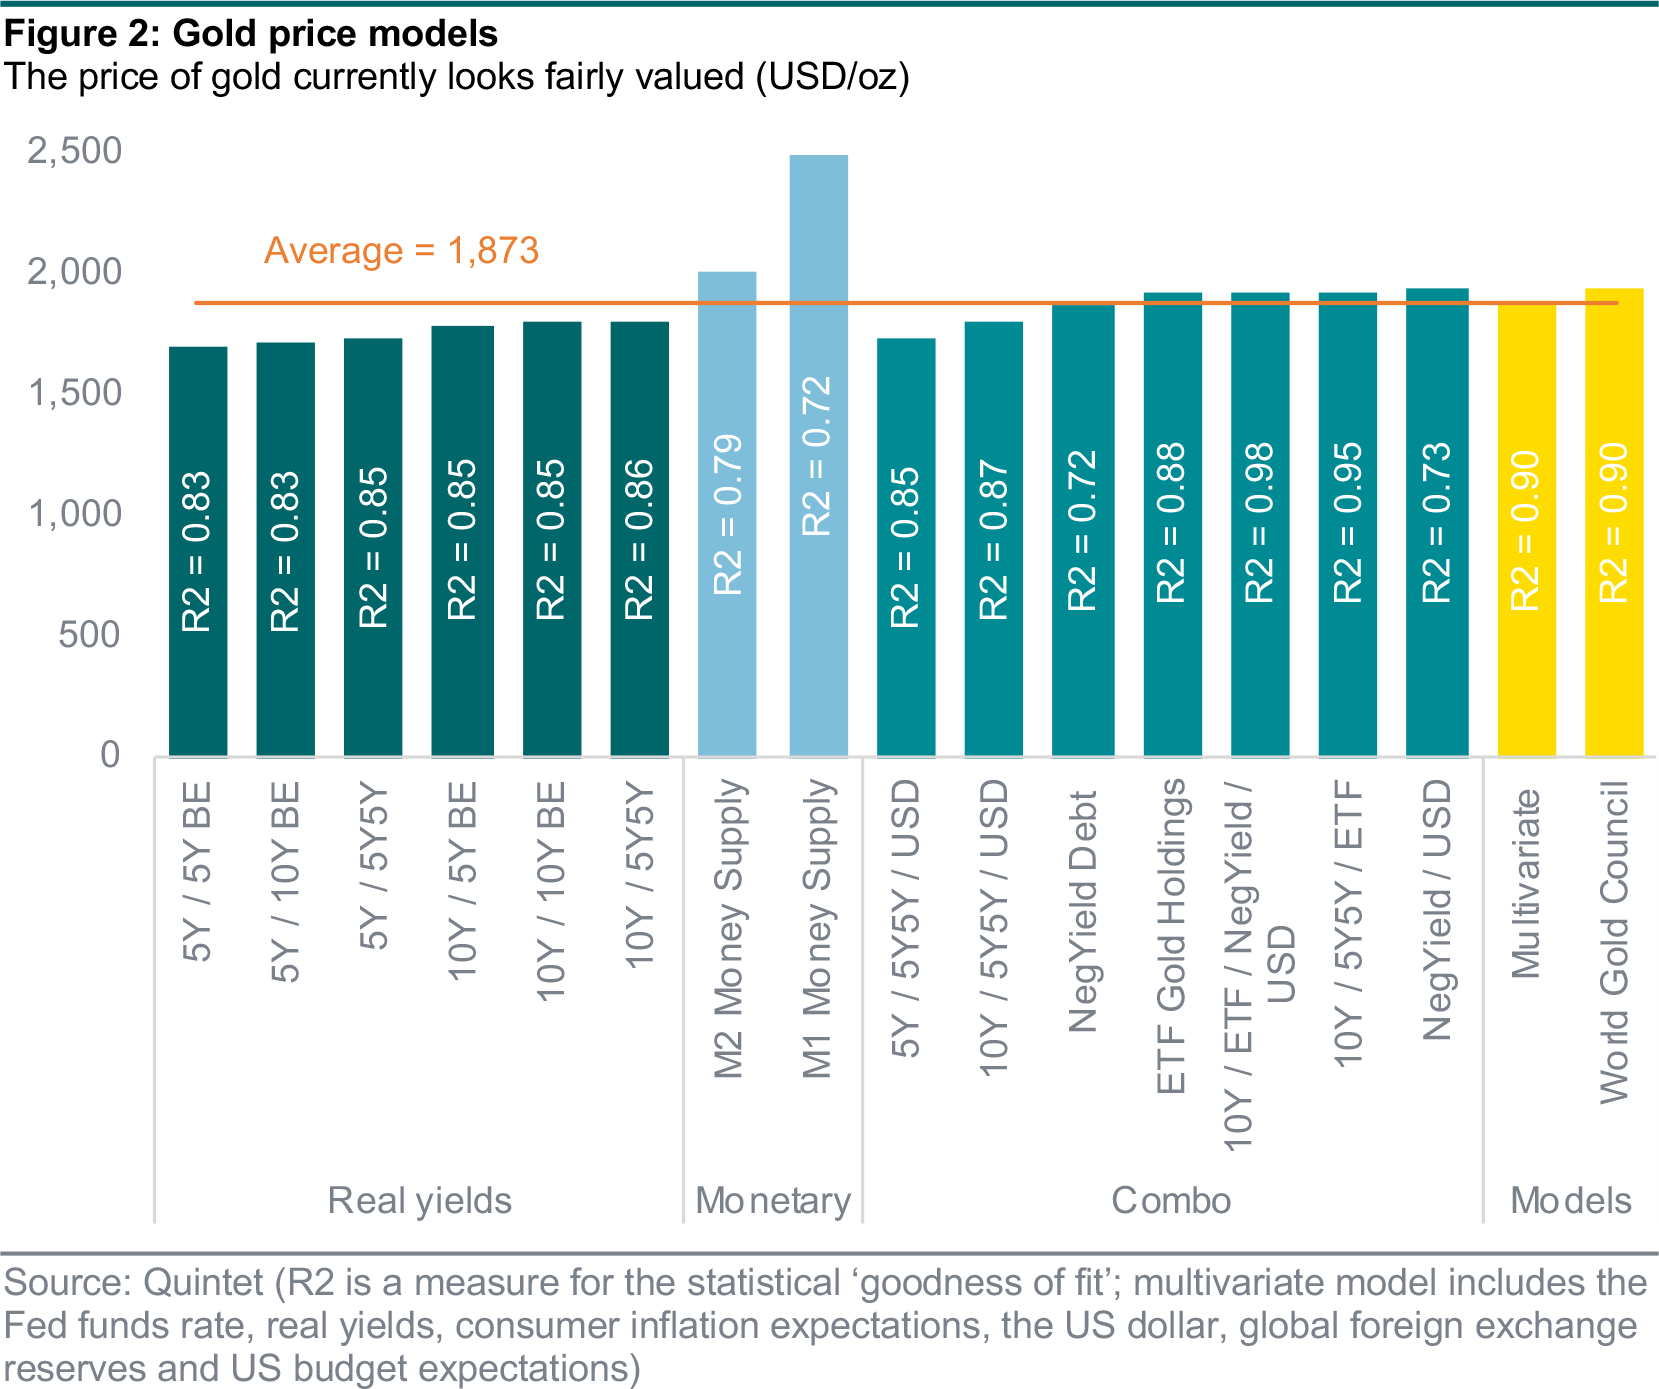
The different gold drivers aren’t equally important. And their relative impact on gold prices varies over time. So we run statistical tests to establish how well they perform as explanatory variables – one by one, in pairs, three at a time and so on, mostly as single equations but also using the econometric model developed by the World Gold Council (figure 2). We then calculate a weighted average for the price of gold that all these statistical models would imply, with the weights representing how well they fit the data. We find that the average price these models imply is around 1,870 $/oz, close to current levels (excluding the highest/lowest estimate, the average is around 1,850 $/oz).
The models based on money supply project gold prices as high as between 2,000 and 2,500 $/oz but, taken on their own, they perform less well. Those based on real yields point to a range of 1,700-1,800 $/oz, and tend to perform better. The best statistical relationship we could find includes gold ETF holdings, both on their own and, especially, when combined with real yields, the US dollar and negative yielding debt. We also test many other variables, such as global foreign exchange reserves and US budget expectations, which improve the robustness of the statistical relationship when combined with real yields, but are difficult to project into the future.
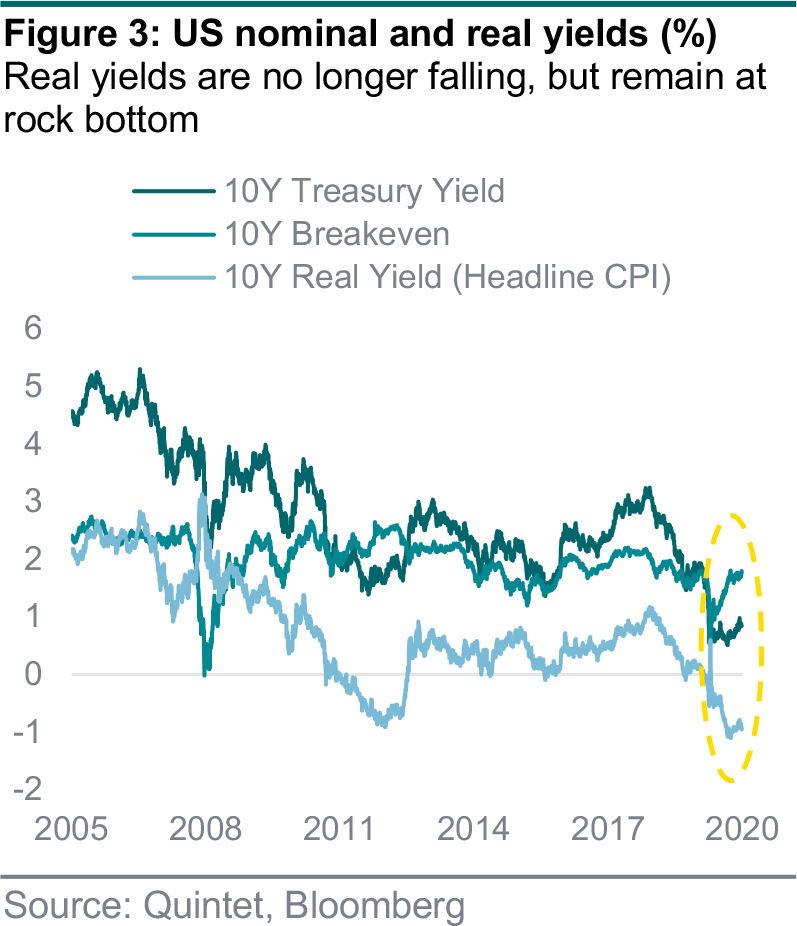
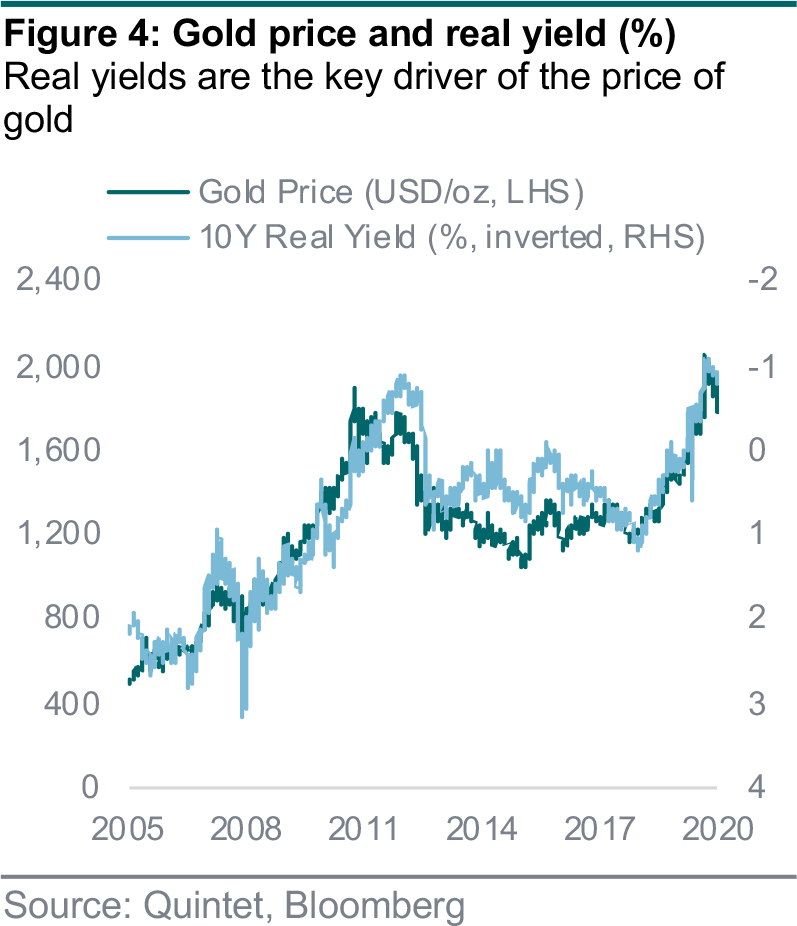
The importance of real yields is twofold. First, we find that their relationship with gold prices is stable over long timeframes. Second, they’re part of the standard set of market variables we monitor and attempt to forecast. Lower real yields of US government bonds increase the relative attractiveness of near-substitutes, such as gold. As economic uncertainty fades, demand for safe-haven assets including gold should fall. But this is only likely to take a little shine off gold prices, as low real yields are a key support. Importantly, though, we don’t expect real yields to fall further from here, as central banks are likely to mitigate any rise in nominal yields, while inflation expectations should rise gradually. This should limit any potential upside to gold prices from here (figures 3 and 4).
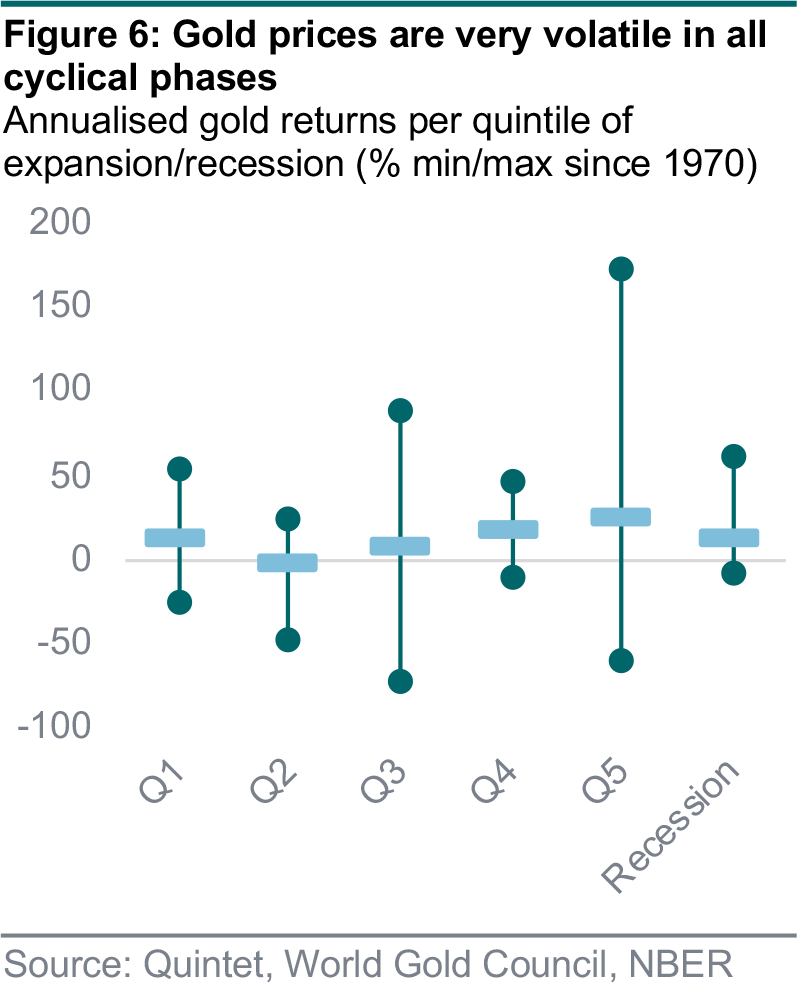
A complementary way to look at gold prices is to see how they perform in different phases of the economic cycle – across several such cycles starting in 1970 (figures 5 and 6). To do this we use the dataset provided by the National Bureau of Economic Research on the chronology of US business cycles – which identifies the dates of peak and trough months in activity based on a range of indicators describing different aspects of the economy, such as: real personal income less transfers, nonfarm payroll employment, real personal consumption expenditures, wholesale-retail sales adjusted for price changes, employment as measured by the household survey and industrial production.
We split each and every cycle in quintiles by calculating annualised gold returns over the first 20% of the time between the trough and peak in economic activity (early cycle), then the subsequent 20% (early to mid-cycle) and so on. We find that, on average, gold returns are particularly strong in mid to late cycle, followed by recessions and the very early phase of the cycle – when things are still quite uncertain and the economy weak. Returns typically turn slightly negative in the early to mid-cycle phase, to bounce back in positive territory in mid-cycle, though the gains are relatively modest. We also find that, given gold’s very high volatility, the variance around these averages is huge: in all phases, the highest returns are always positive, while the lowest ones always negative.
An alternative approach, which uses quarterly GDP figures and defines recessions as at least two quarters of consecutive contraction, provides qualitatively similar results, but with some differences: returns are highest and of a similar order of magnitude in the later stages of the cycle and in recessions; they’re positive in the first quintile and negative in the second one in our approach, vice versa in the alternative one. Ultimately, we use the NBER definition because it’s more granular and defines cyclical phases based on sustained macro dynamics, avoiding the classification problem of, say, two quarters of contraction, followed by one of expansion and then one of contraction again.
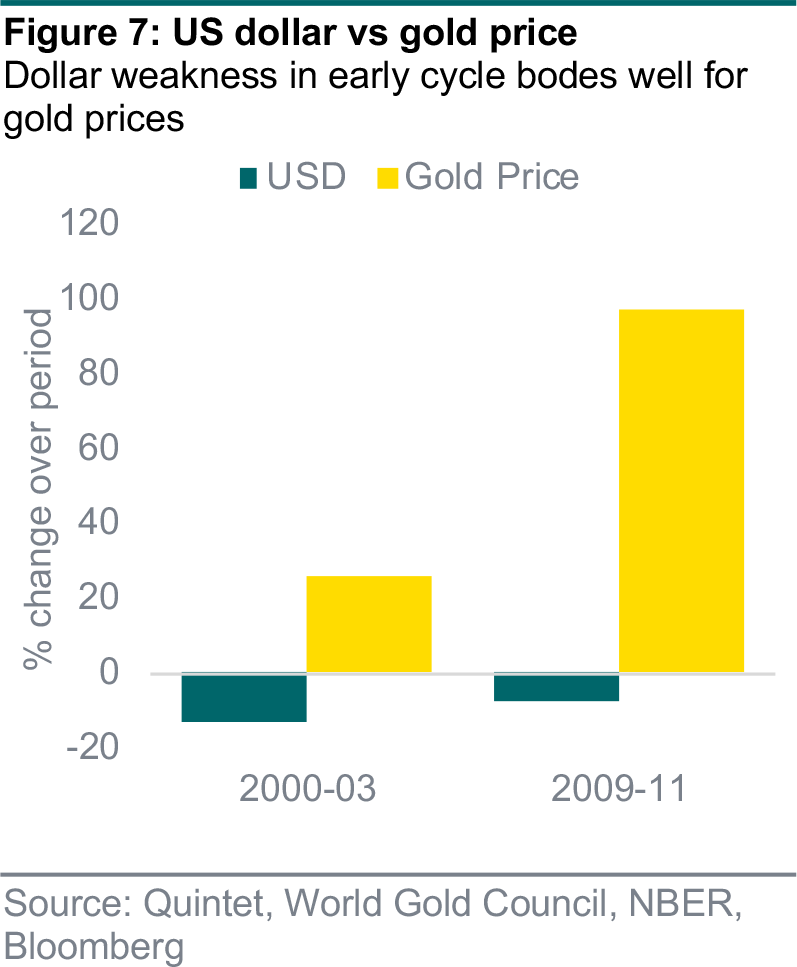
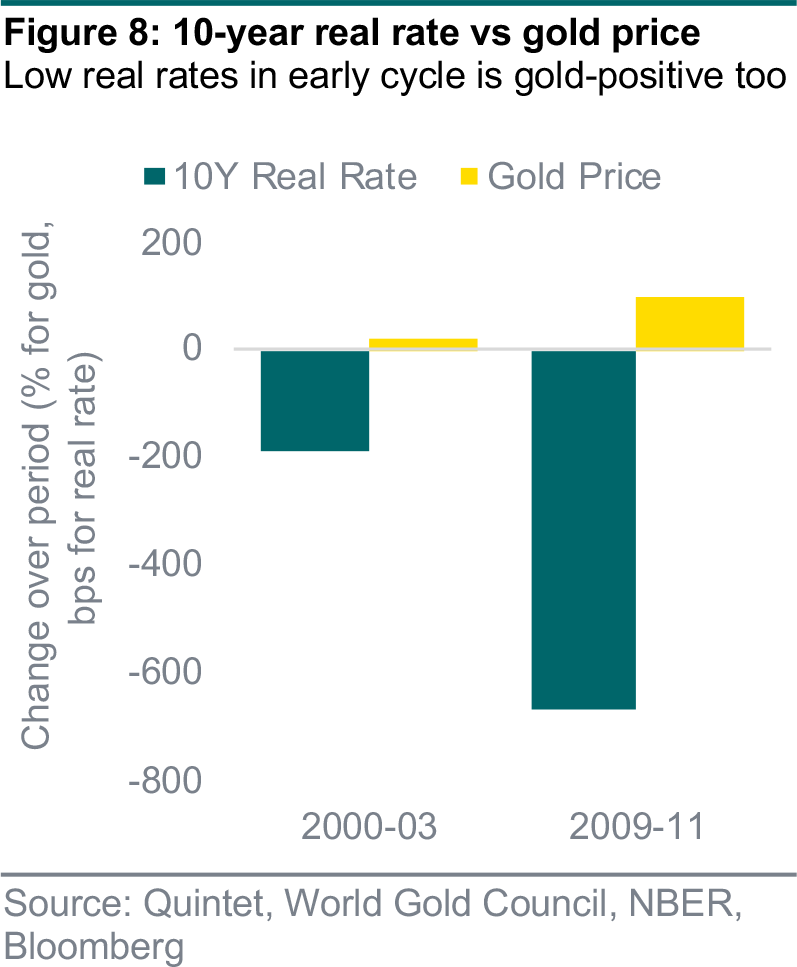
We also find that US dollar weakness tends to coincide with gold price appreciation. When nominal and real yields fall, these dynamics are particularly pronounced, as shown in figures 7 and 8, which illustrates these dynamics in the early phases of the past two cycles. Conversely, US dollar strength tends to coincide with gold price depreciation, regardless of what happens to nominal and real yields. This appears to be a consistent pattern across most cycles since the 1970s, and is also in line with the findings of our statistical models, which show that real yields and the US dollar – especially when taken together – are among the most important drivers of gold prices.

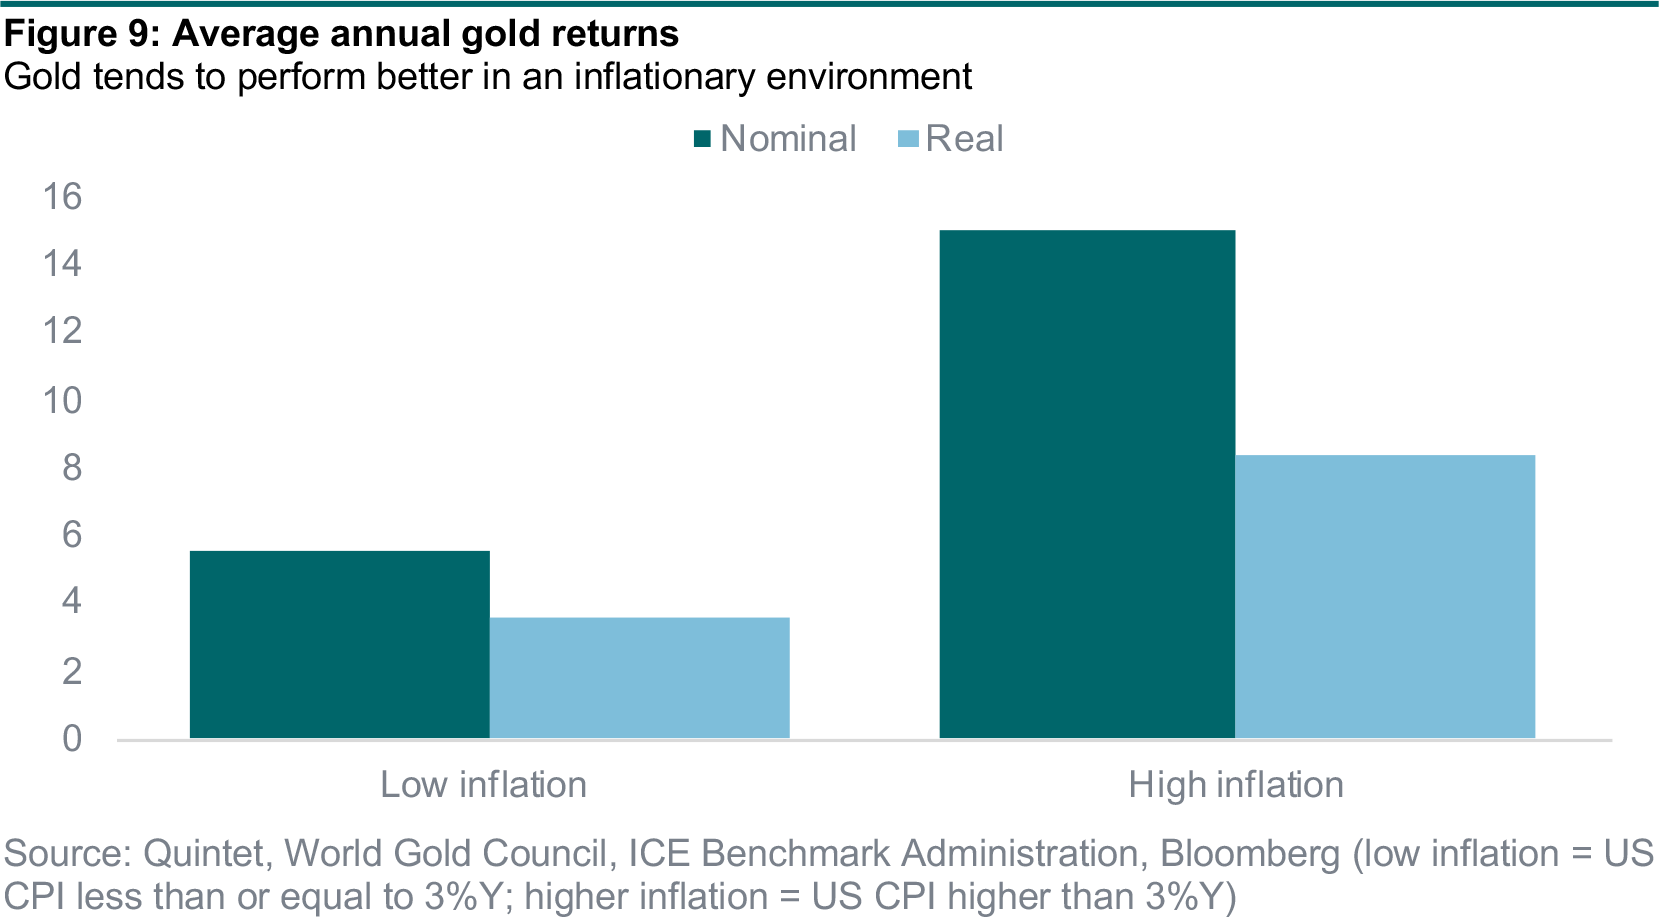
Looking at all cycles since 1970, the relationship between gold prices, the US dollar and real yields is quite stable and tends to hold in each and every quintile with very few exceptions (figure 9). The most notable one is the mid to late 1980s, when gold prices did decline despite a weakening US dollar and falling real yields. This is because the inflation regime changed around that time. To bring inflation under control, Fed policy tightened significantly in the early 1980s, bond yields rose sharply and the dollar strengthened. This was followed by a period of disinflation, which coincided with dollar weakness and falling yields, but also with lower gold prices – given that inflation declined materially, and inflation expectations adjusted lower too. Basically, all else being equal, gold does better when inflation is high and rising, and does worse when inflation is low and falling.
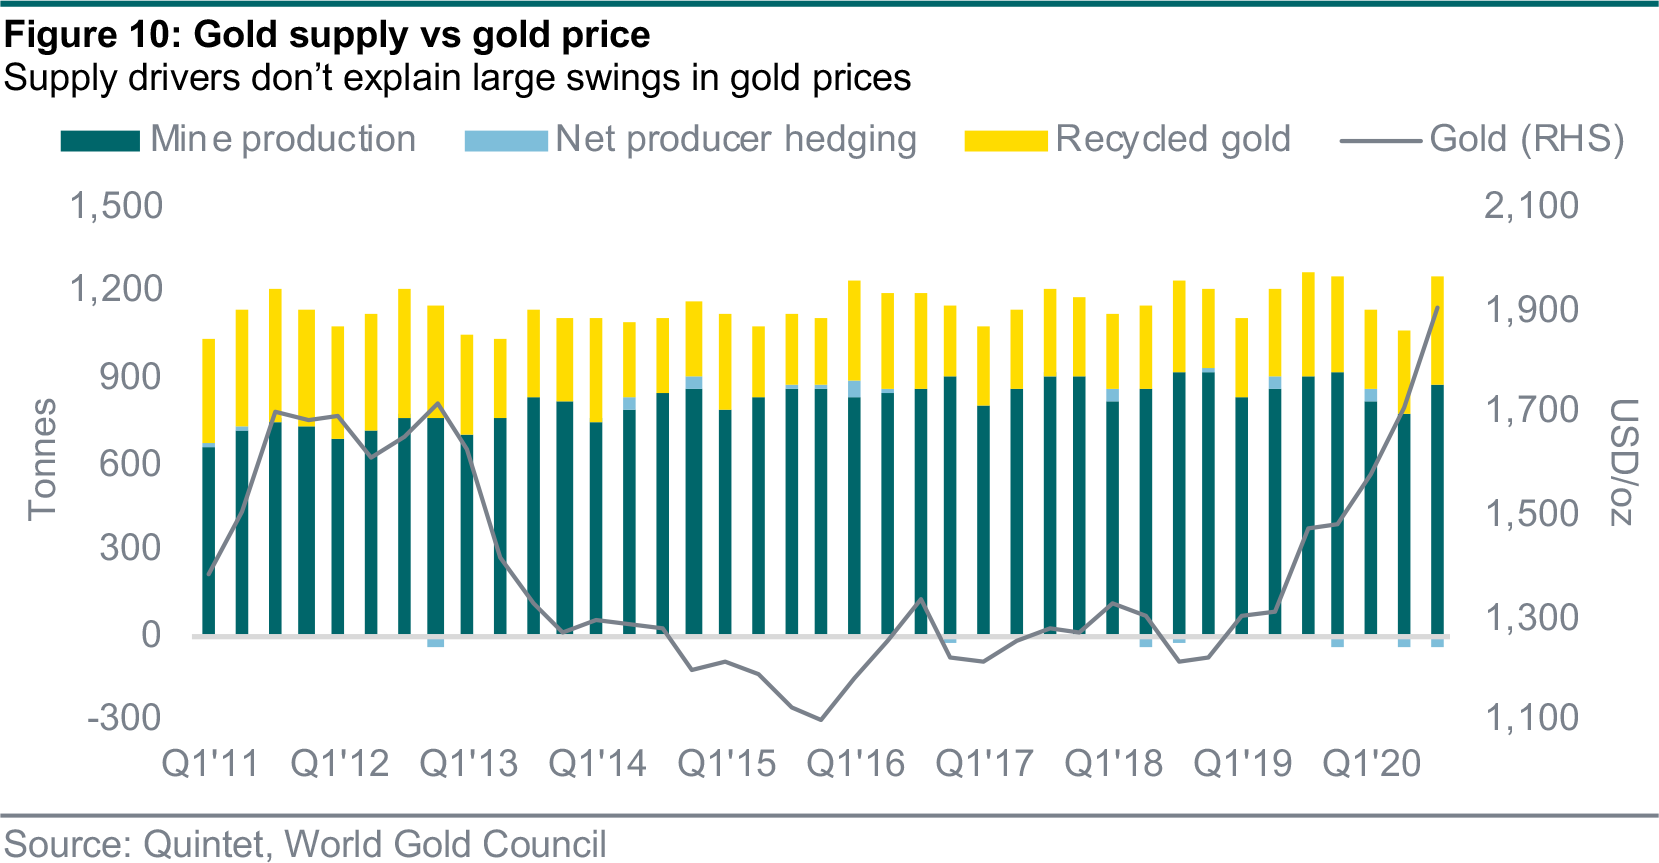
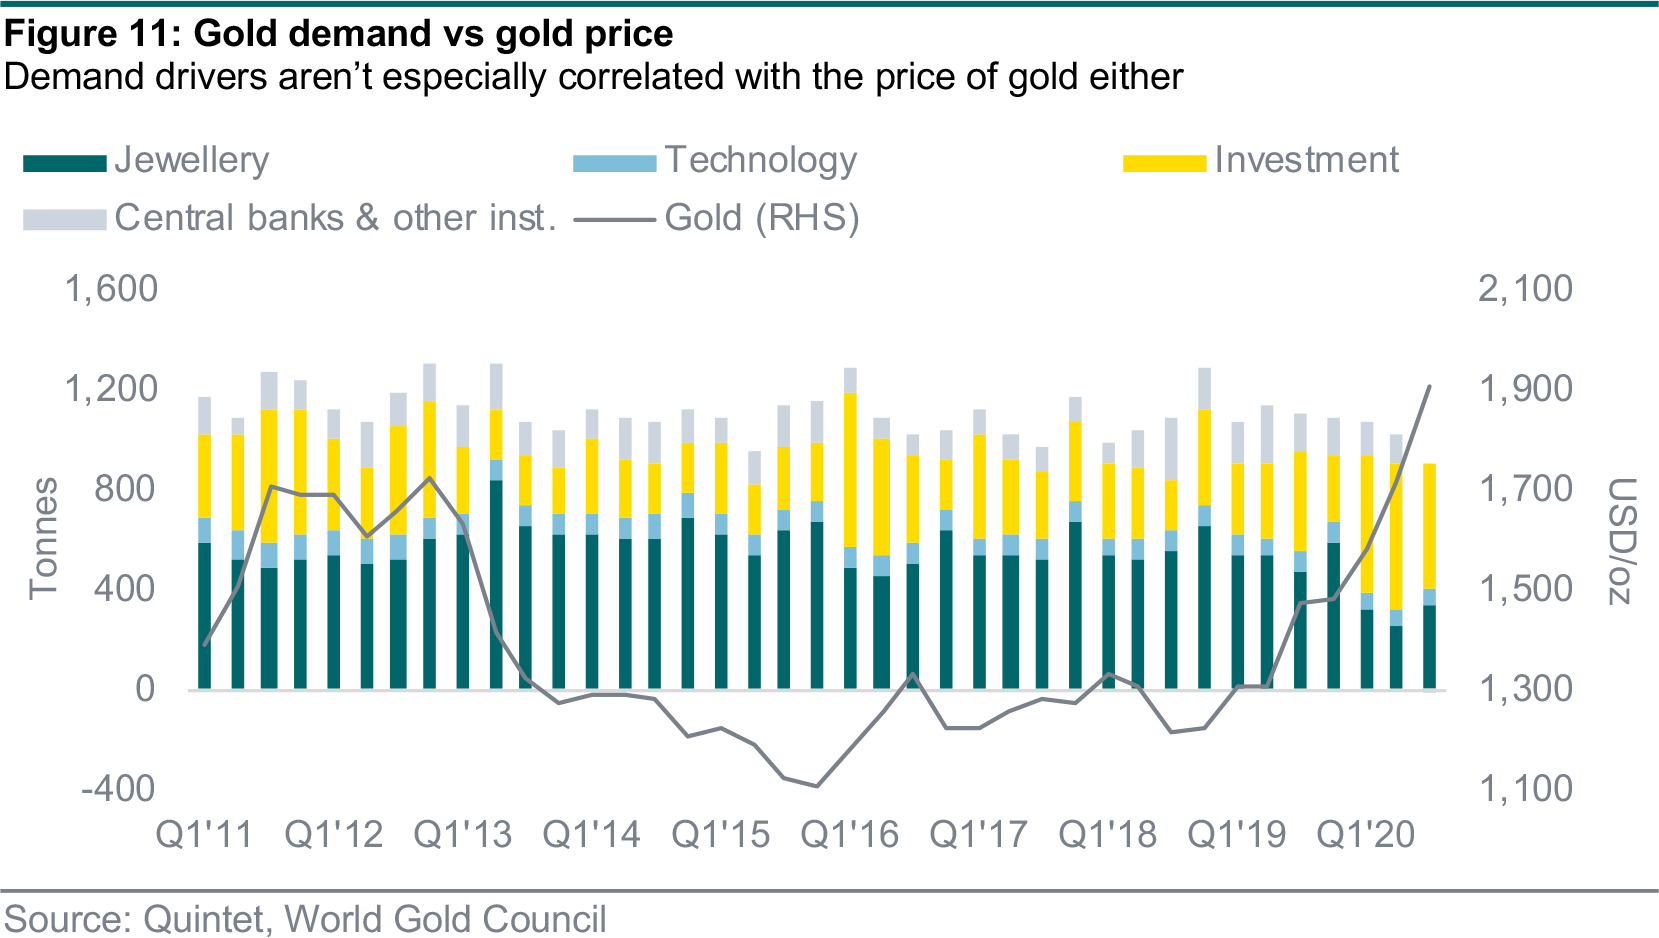
A final perspective on gold prices has to do with their relationship with the different sources of supply and demand (figures 10 and 11). From a supply perspective, the latest trends indicate that gold mine production and recycling are both picking up. On the demand side, the jewellery and technology categories are picking up too, consistently with our call of economic recovery, but from a low base. Central bank buying took a setback in the third quarter, but recent reports indicate that it was most likely a one-off, with gold purchases having resumed at the start of this quarter. Remarkably, even though these drivers have some correlation with gold prices over extended timeframes, the link is loose at best.
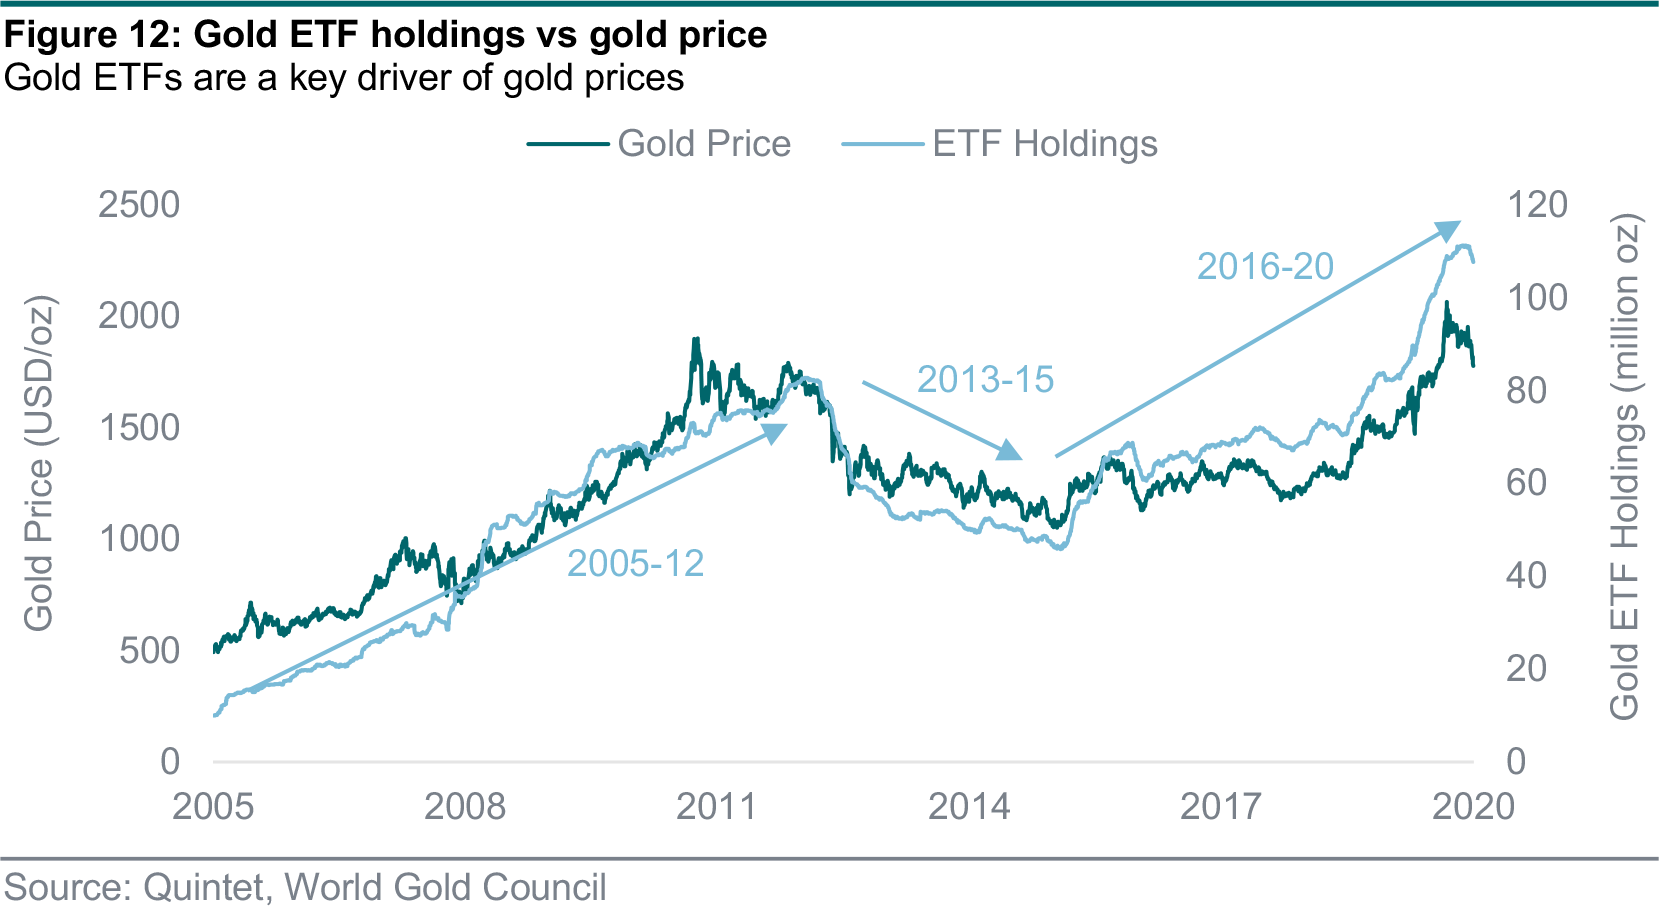
The only demand driver that appears to be correlated with gold prices is the investment category. In particular, gold ETF holdings do have a tight relationship with the price of gold – which makes intuitive sense and is also in line with our estimated statistical models (figure 12). These holdings have been rising sharply this year – to a record high. They’ve driven gold prices higher, over and above what real yields and other fundamental, macro drivers would have implied. The past few weeks have seem modest declines in ETF holdings – a dynamic that has tended to show a degree of persistence. This means that, once they start rising, they do for a while. But, equally, once they start falling, they do for a while too. Over the near term, this is probably a downside risk for gold, although things won’t necessarily move in a straight line. For example, gold prices are seasonal and tend to be positive at the start of the year, but then turn negative again in the spring.
The three perspectives we consider in this piece suggest there isn’t much downside to gold prices from current levels, but neither is there much upside:
Putting it all together, we recalibrate our gold price forecast. We now expect a modest increase to about 1,900 $/oz at the end of next year, some 100 $/oz lower than our previous forecast. Our view is that, over the next few months, we may see quite a few oscillations: investment flows may continue to correct for some time; but the all-important drivers of rock-bottom real yields and US dollar weakness should remain quite supportive. More broadly, most fundamental factors are positive for gold, although the majority of them don’t indicate that prices should be higher (or much higher anyway). The outlook for 2022, being so far away, is quite uncertain. On balance, the fundamentals won’t really change, in our view, with one exception: we may see higher inflation the year after next. This is why we confirm our forecast of 2,000 $/oz.
As we think about gold as an investment, there can be different reasons for having it in a portfolio:
Globally confirmed cases have reached almost 72 million, with more than 1.6 million fatalities. Yet there are regional differences (figure 13). The pace of new infections in Europe was slowing but has recently flattened, which is surprising because many countries have not relaxed lockdown measures. They have even been tightened in some countries with rising infection rates, including Germany and the Netherlands. Belgium, France and Italy seem to have passed the peak of the second wave and started to loosen their restrictions slightly. Overall, European Covid-19 cases are around the levels seen two months ago.
The US is suffering a record high infection rate, largely because there were no restrictions on meeting and travelling over the Thanksgiving holiday weekend. There are now over 16 million confirmed cases, and the seven-day average of new infections has reached a new high of over 200,000. This increase is unlikely to fall back any time soon, which suggests the third wave has not yet peaked. Several states have announced lockdowns to limit the spread of the virus and avoid overloading their health systems, including California and New York.
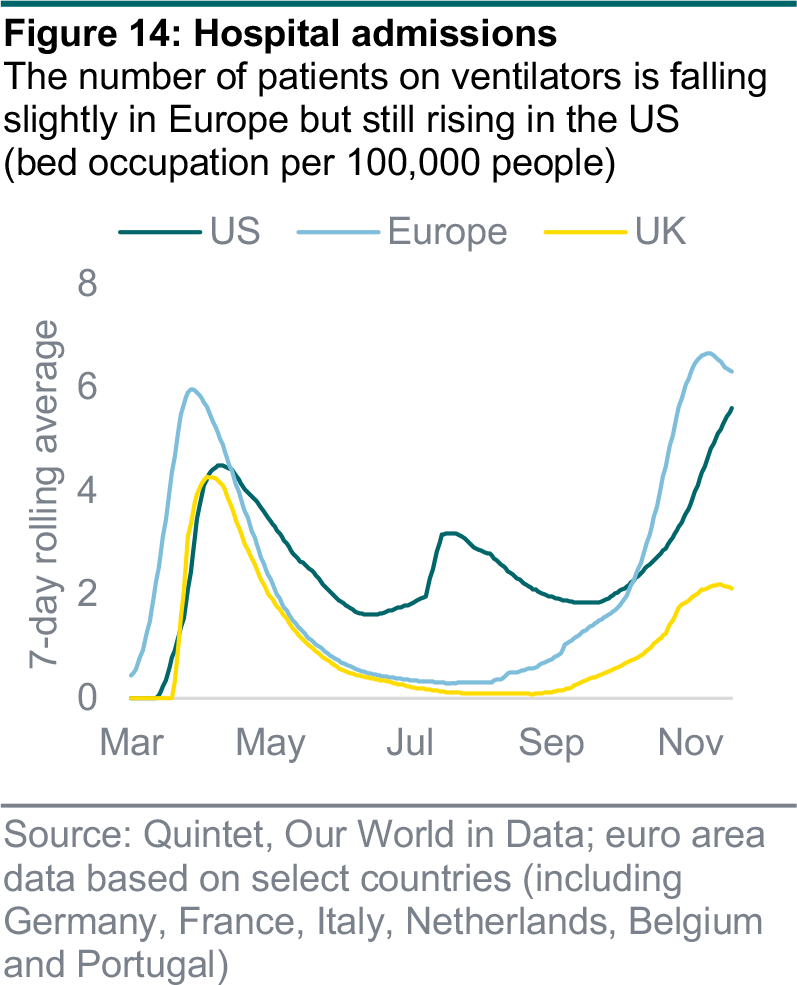
The occupation of intensive care units (ICUs) has reached critical levels in both Europe and the US. Although the rate is falling slightly in Europe, it’s still rising in the US, which is probably because Europe reintroduced lockdown measures (figure 14). However, the rate of people being admitted to hospital is higher than it was in the spring. With fewer restrictions in place, America’s health system looks more vulnerable.
Vaccination programmes and higher temperatures should improve the situation gradually from spring onwards on both sides of the Atlantic. The UK has already started vaccinating people, the US is starting this week, and continental Europe should begin in January. When combined with further medical progress in treating the symptoms, these factors should imply a wider and more permanent reopening of many sectors of the global economy. Meanwhile, government and central bank stimulus should continue to support the recovery.

Authors:
AJ Singh Head of ESG & Sustainable Investing
Bas Gradussen Sustainable Investment Strategist
Giang Vu Sustainable Investment Strategist
Martynas Rudavicius Sustainable Investment Strategist
This document has been prepared by Quintet Private Bank (Europe) S.A. The statements and views expressed in this document – based upon information from sources believed to be reliable – are those of Quintet Private Bank (Europe) S.A. as of 14 December 2020, and are subject to change. This document is of a general nature and does not constitute legal, accounting, tax or investment advice. All investors should keep in mind that past performance is no indication of future performance, and that the value of investments may go up or down. Changes in exchange rates may also cause the value of underlying investments to go up or down.
Copyright © Quintet Private Bank (Europe) S.A. 2020. All rights reserved.
.svg?ext=.svg)