
Quintet’s sustainable investing philosophy comprises a toolkit of approaches and dedicated assets. In this primer we deep dive into the leader approach – the most popular sustainable investing strategy.
Leader strategies, also known as “best in class”, seek to identify entities that are managing their environmental, social, governance (ESG) risks and opportunities better than their peers.
What is the investment thesis?
Investors deploying leader strategies expect fewer adverse events – such as accounting scandals. They believe that a holistic approach to business will generate improved cash flows through factors such as increased customer loyalty, greater employee productivity and collaborative supply chain partners.
How can leaders be identified?
Leader identification can be the result of ESG headline ratings, such as those provided by Sustainalytics or MSCI. This approach, while easy to implement, relies on third-party methodology and may oversimplify complex sustainability issues.
Alternatively, an investor can identify leaders by integrating material ESG information directly into their financial models, aiming to quantify the impact on revenue, risk and profitability.
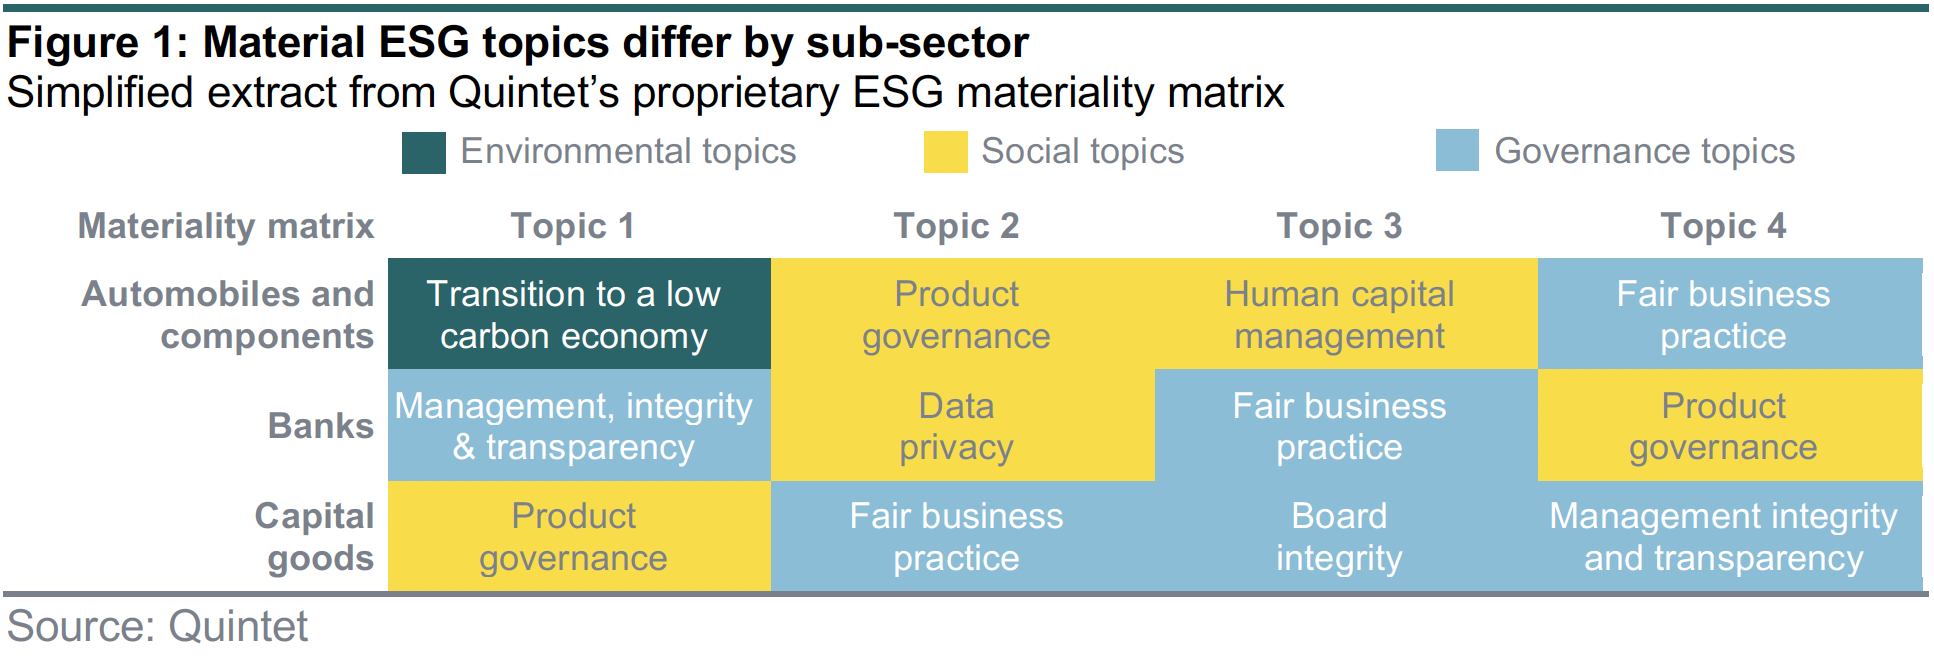
At Quintet we combine leading industry standards, such as the Sustainability Accounting Standard Board, and in-house expertise to identify material ESG topics across a range of sectors. We give greater weight to factors that can impact value significantly.
For example, water is important for the food and beverage industry, as water scarcity could have an adverse effect on operational continuity. In contrast for banks, water scarcity has a negligible impact on operations (figure 1).
How does one construct leader strategies?
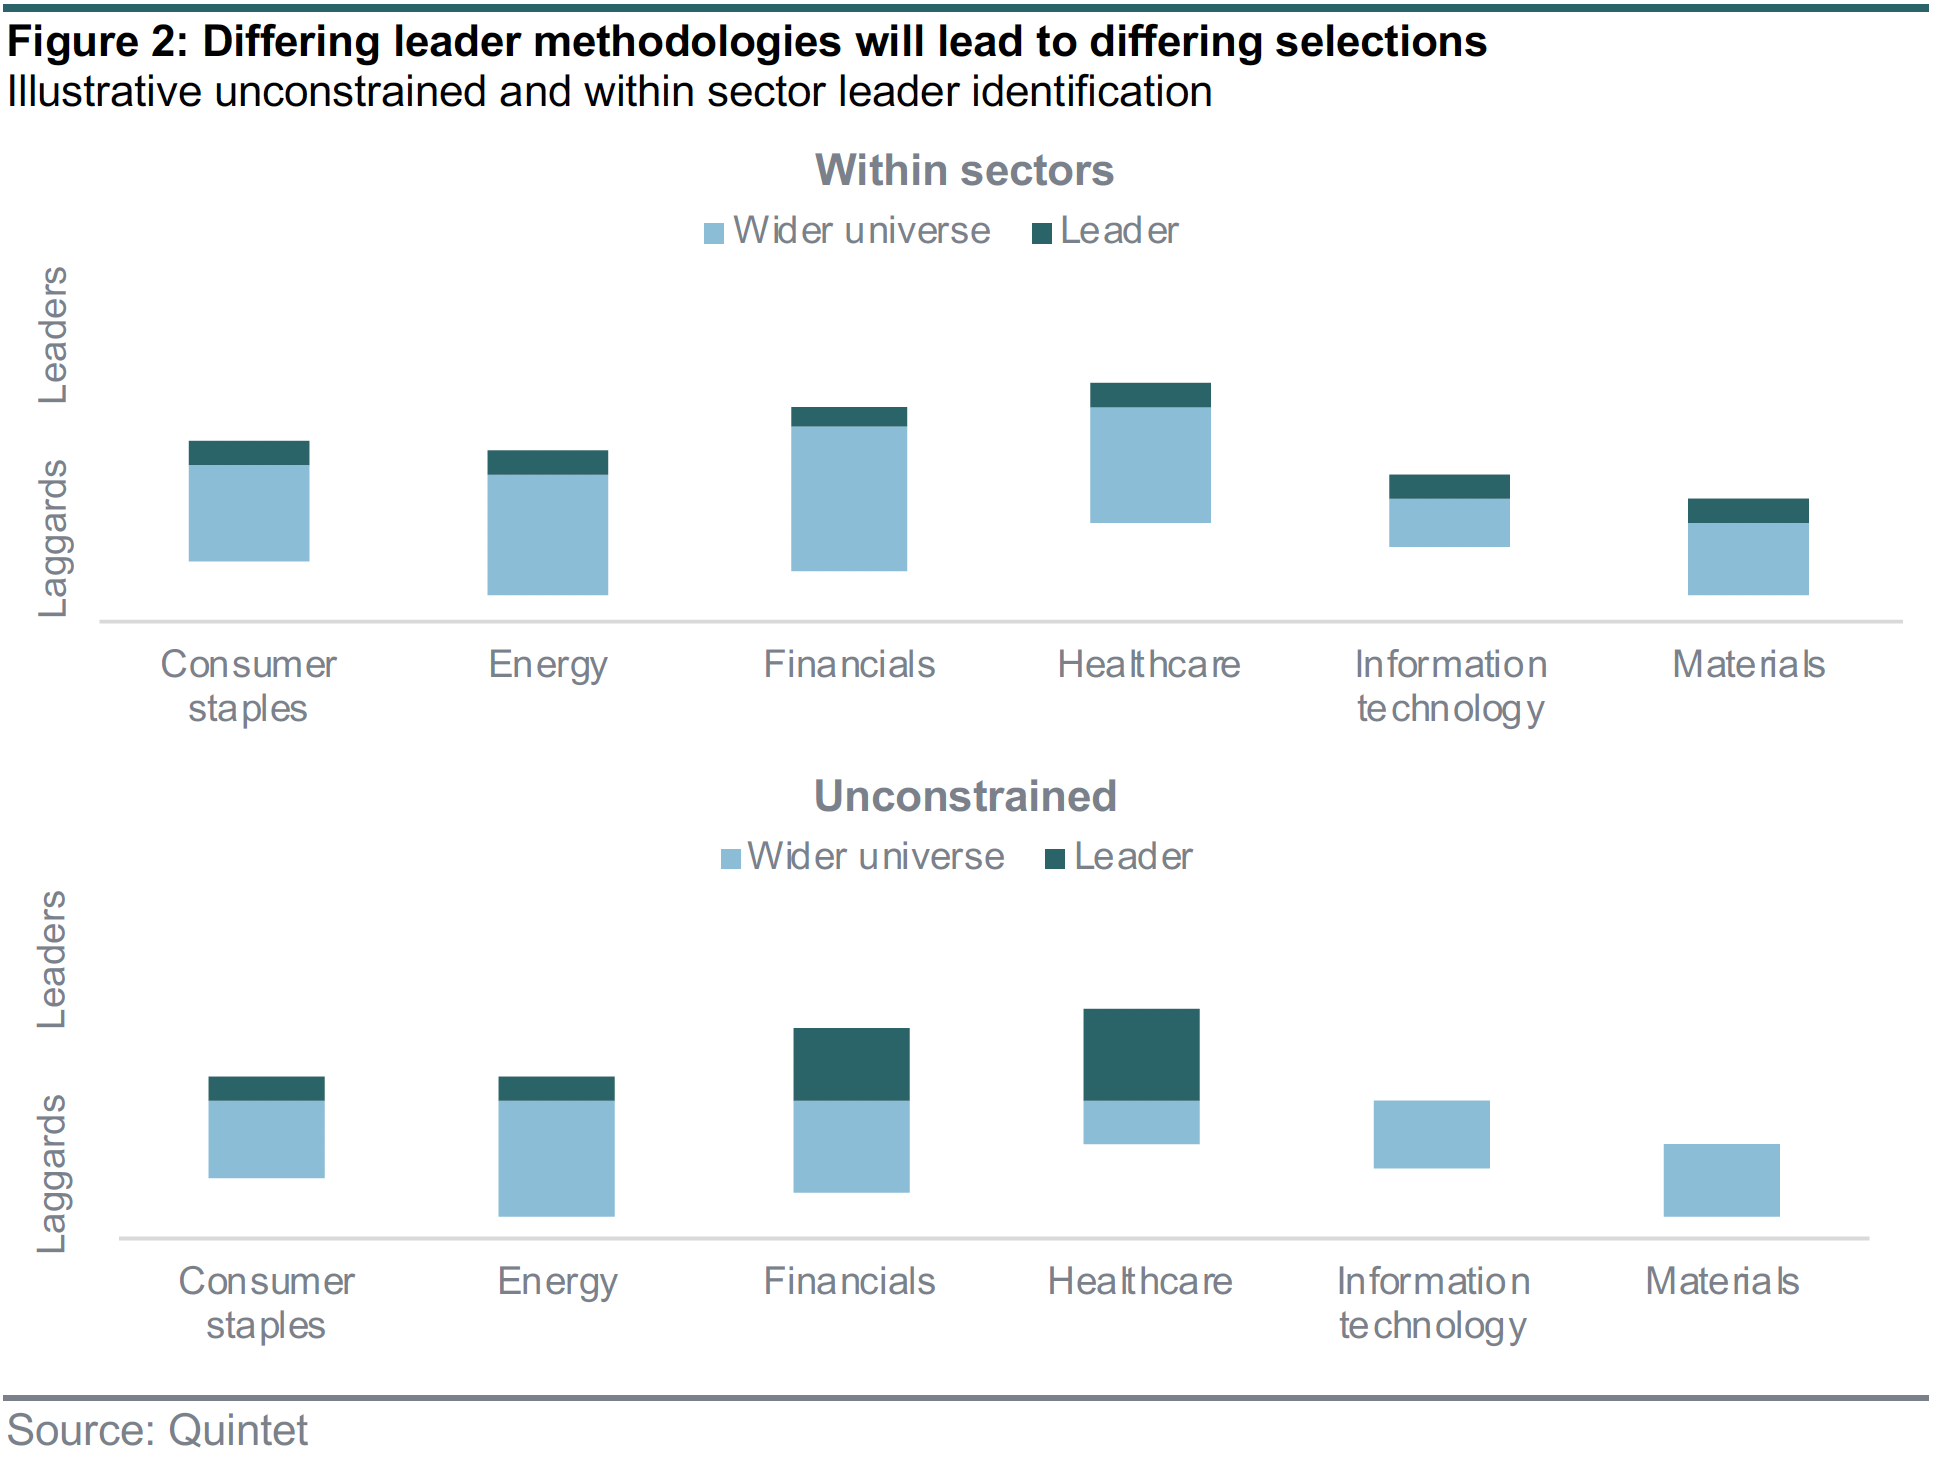
Leader strategies can be unconstrained and constructed without reference to sector or regional weights. This approach may lead to large deviations compared with conventional benchmarks as entire portions of the market may not be selected. Alternatively, leader identification can be implemented within sectors and regional peer groups, leading to smaller benchmark deviations but with a greater number of unintuitive selections, such as the leading base metal miner. In figure 2 we show how the two approaches would lead to differing leader identification.
Do leader strategies utilise exclusions?
It is estimated that 26% of sustainable investing fund assets combine a leader approach with additional exclusionary criteria.1 They include excluding entities with severe controversies and/or companies with revenue exposure to controversial activities, such as weapons or fossil fuels.
1. Goldman Sachs (2020). GS SUSTAIN: ESG Nifty Fifty Series How have ESG fund favourites changed in 2020: 30
Leader strategies have been shown to support better ESG practices and may improve investor returns.
Why are leader strategies good for people and planet
Leader strategies enable investors to align their investments with their preferences. By investing via a leader strategy investors can signal the importance of positive ESG practices and motivate entities to improve. Leader strategies have most influence when large amounts of capital are mobilised. This can raise awareness of leaders and laggards and put pressure on laggards to improve their practices.
Are leader strategies good for your portfolio?
Academic evidence suggests leader strategies are additive to risk and return. Aggregated evidence from more than 2,000 studies found a non-negative relationship between sustainability and corporate financial performance in 90% of studies.2 Equities in the top quartile on material ESG issues were found to outperform their bottom quartile peers by more than 2.7% per annum, according to a study of more than 2,000 US companies over two decades.3
Practitioner evidence supports the academic findings, with Goldman Sachs demonstrating that leaders in the top quartile delivered 180bps higher economic returns relative to the firm’s cost of capital compared to the bottom quartile.4
MSCI found that the top-quintile equity leaders were approximately three times less likely to suffer a 95% drawdown than bottom-quartile firms, a relationship that holds for 25% and 50% drawdowns and over a range of time windows.5
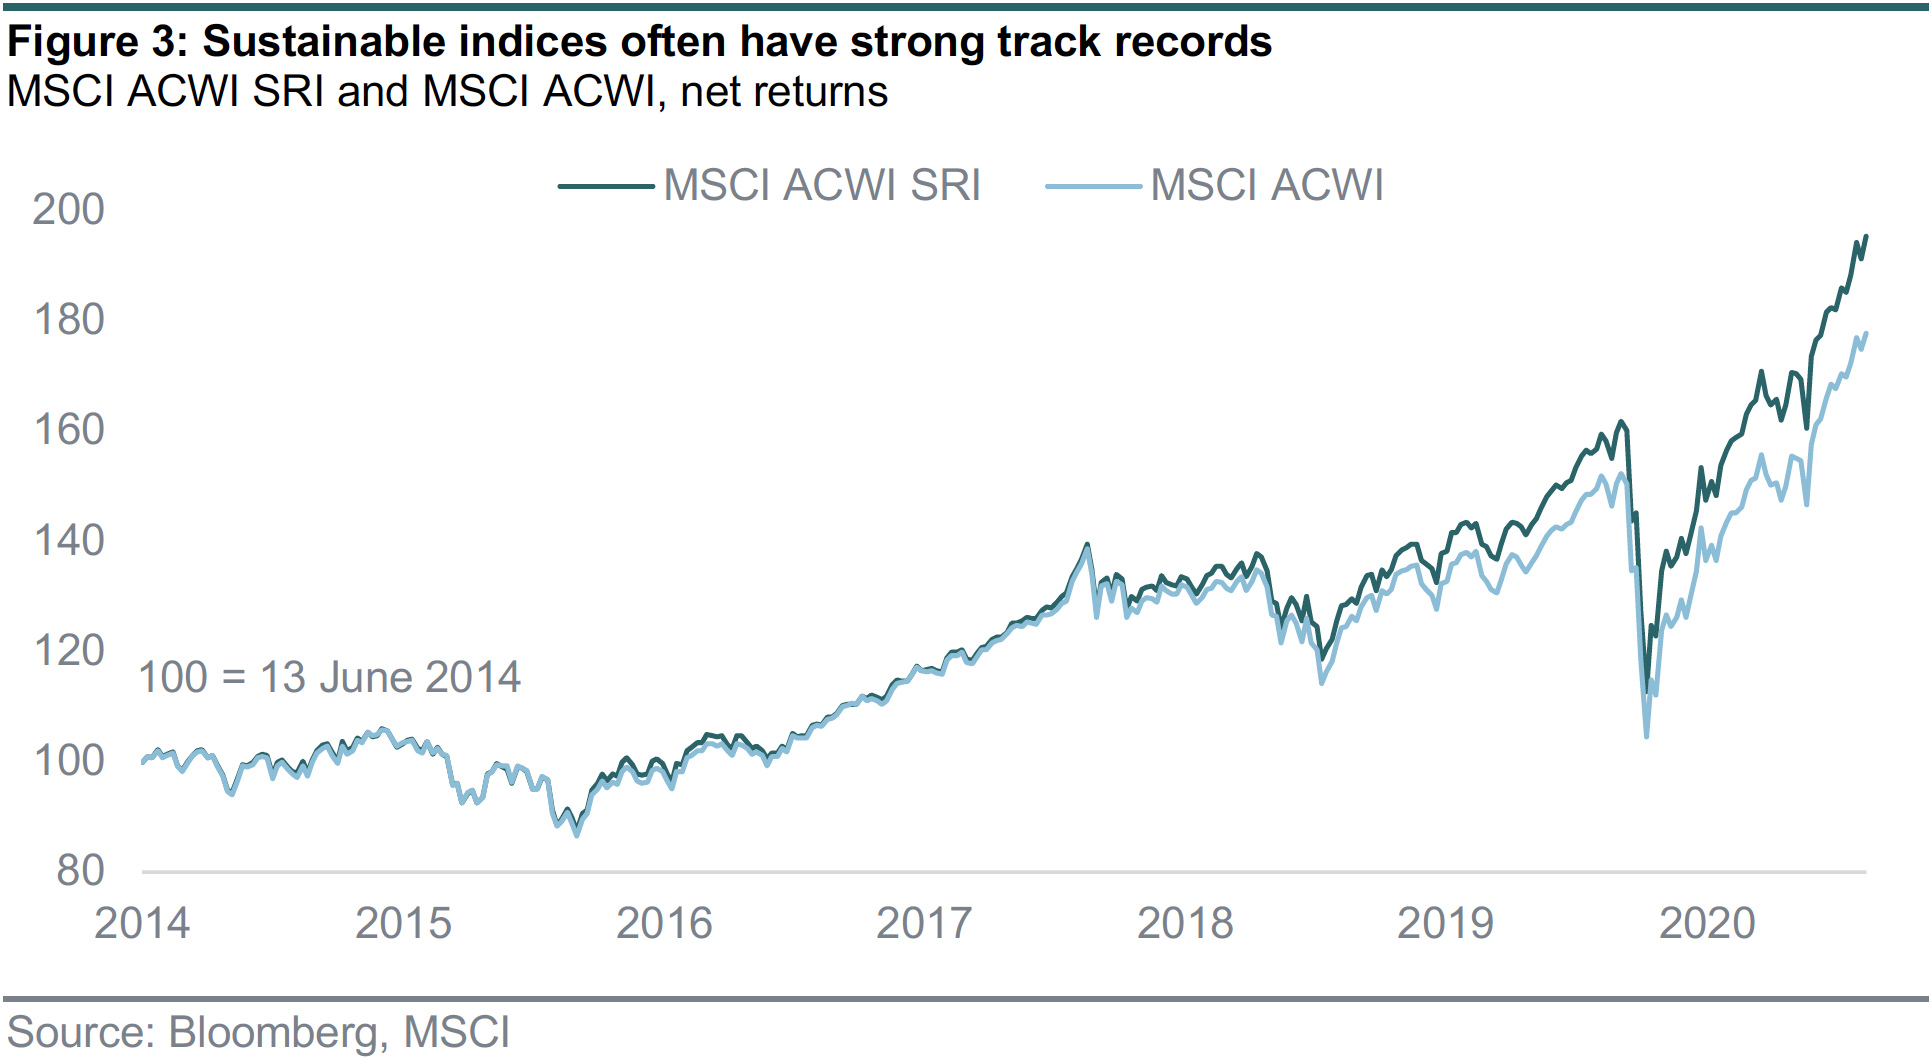
A number of leader indices have long and robust track records. The popular MSCI All Countries World SRI index has been live since March 2014 and has outperformed its conventional MSCI All Countries World peer by 18% (figure 3).
Recent years have been particularly favourable to sustainable leader strategies as social trends and technological development accelerated. Research firm Morningstar found that 42% of sustainable equity funds in 2020 had first-quartile performance relative to peers with just 6% of sustainable equity funds producing fourth-quartile performance.6
What portfolio characteristics do leader strategies exhibit?
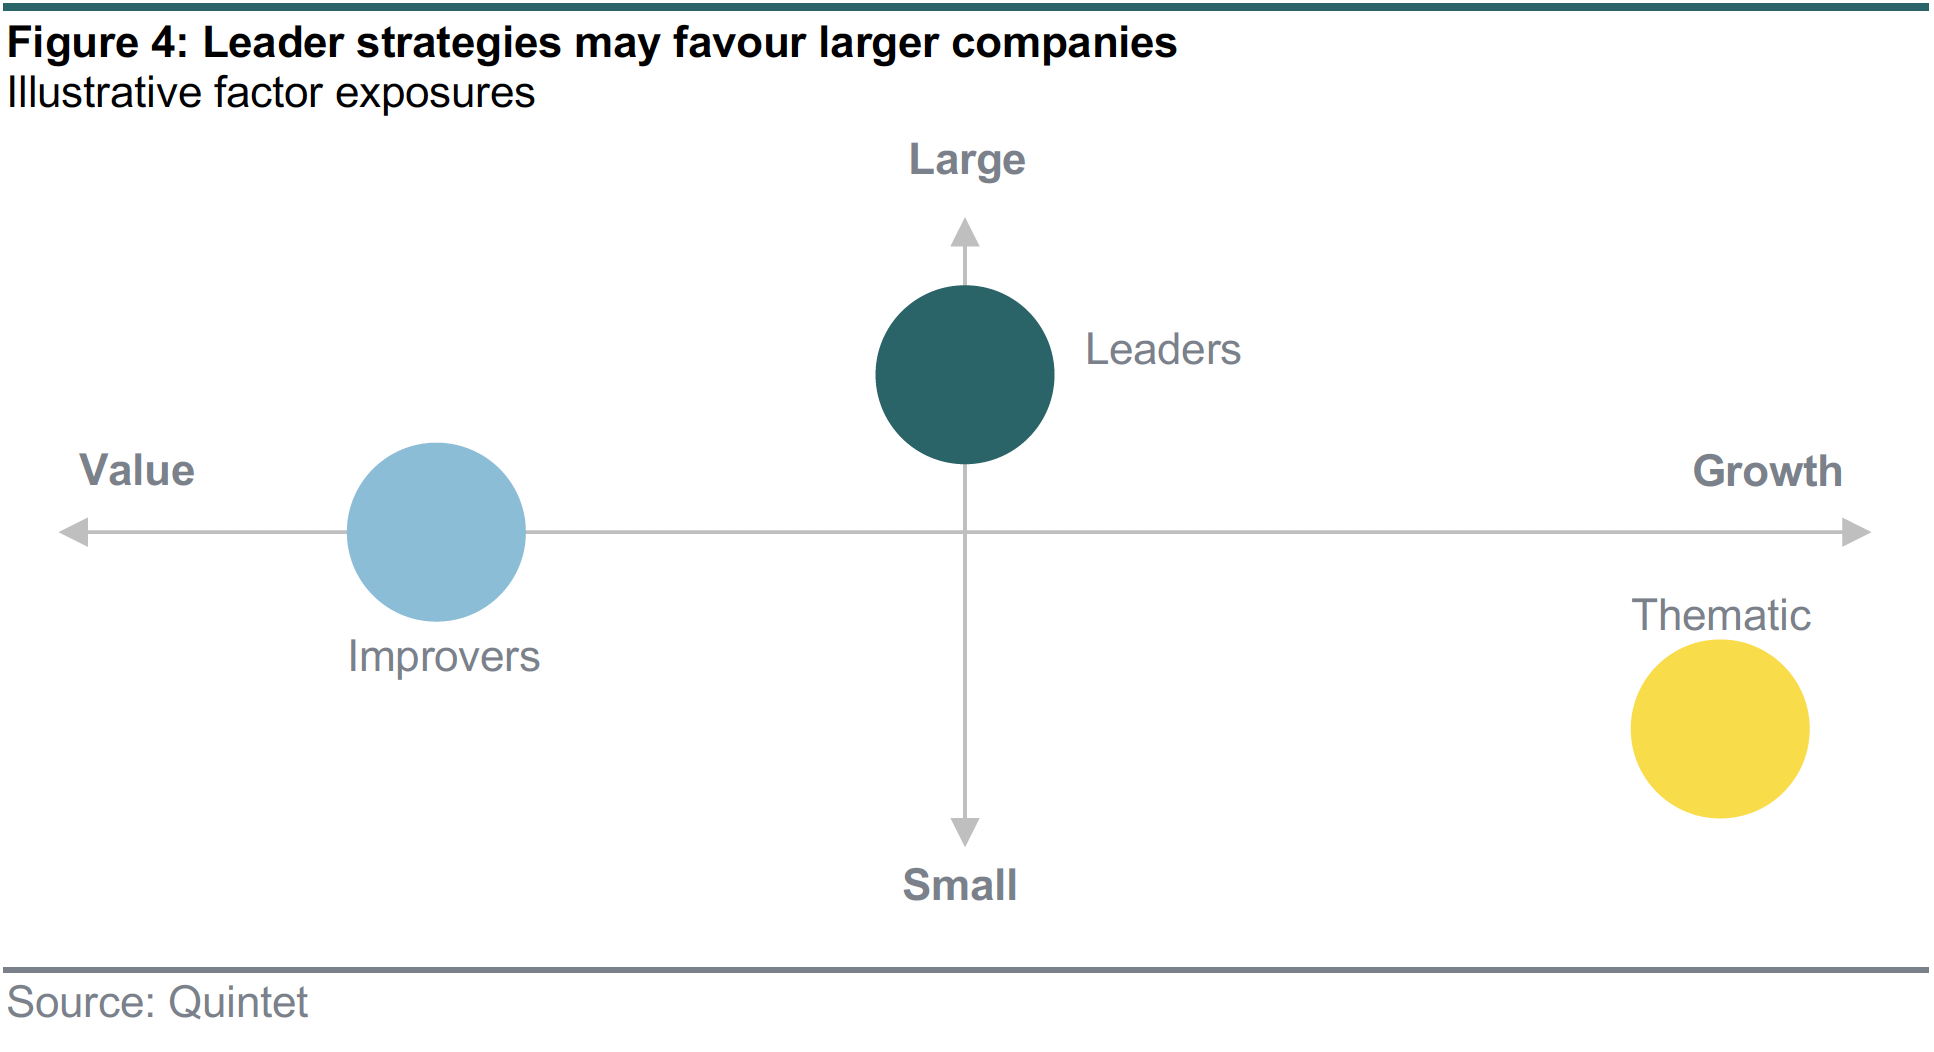
Leaders tend to be well-run entities and often offer defensive characteristics, such as a quality bias. Leader strategies may favour larger companies due to greater ESG disclosure and more abundant resources to implement robust sustainability strategies (figure 4).
Are leader strategies typically active or passive?
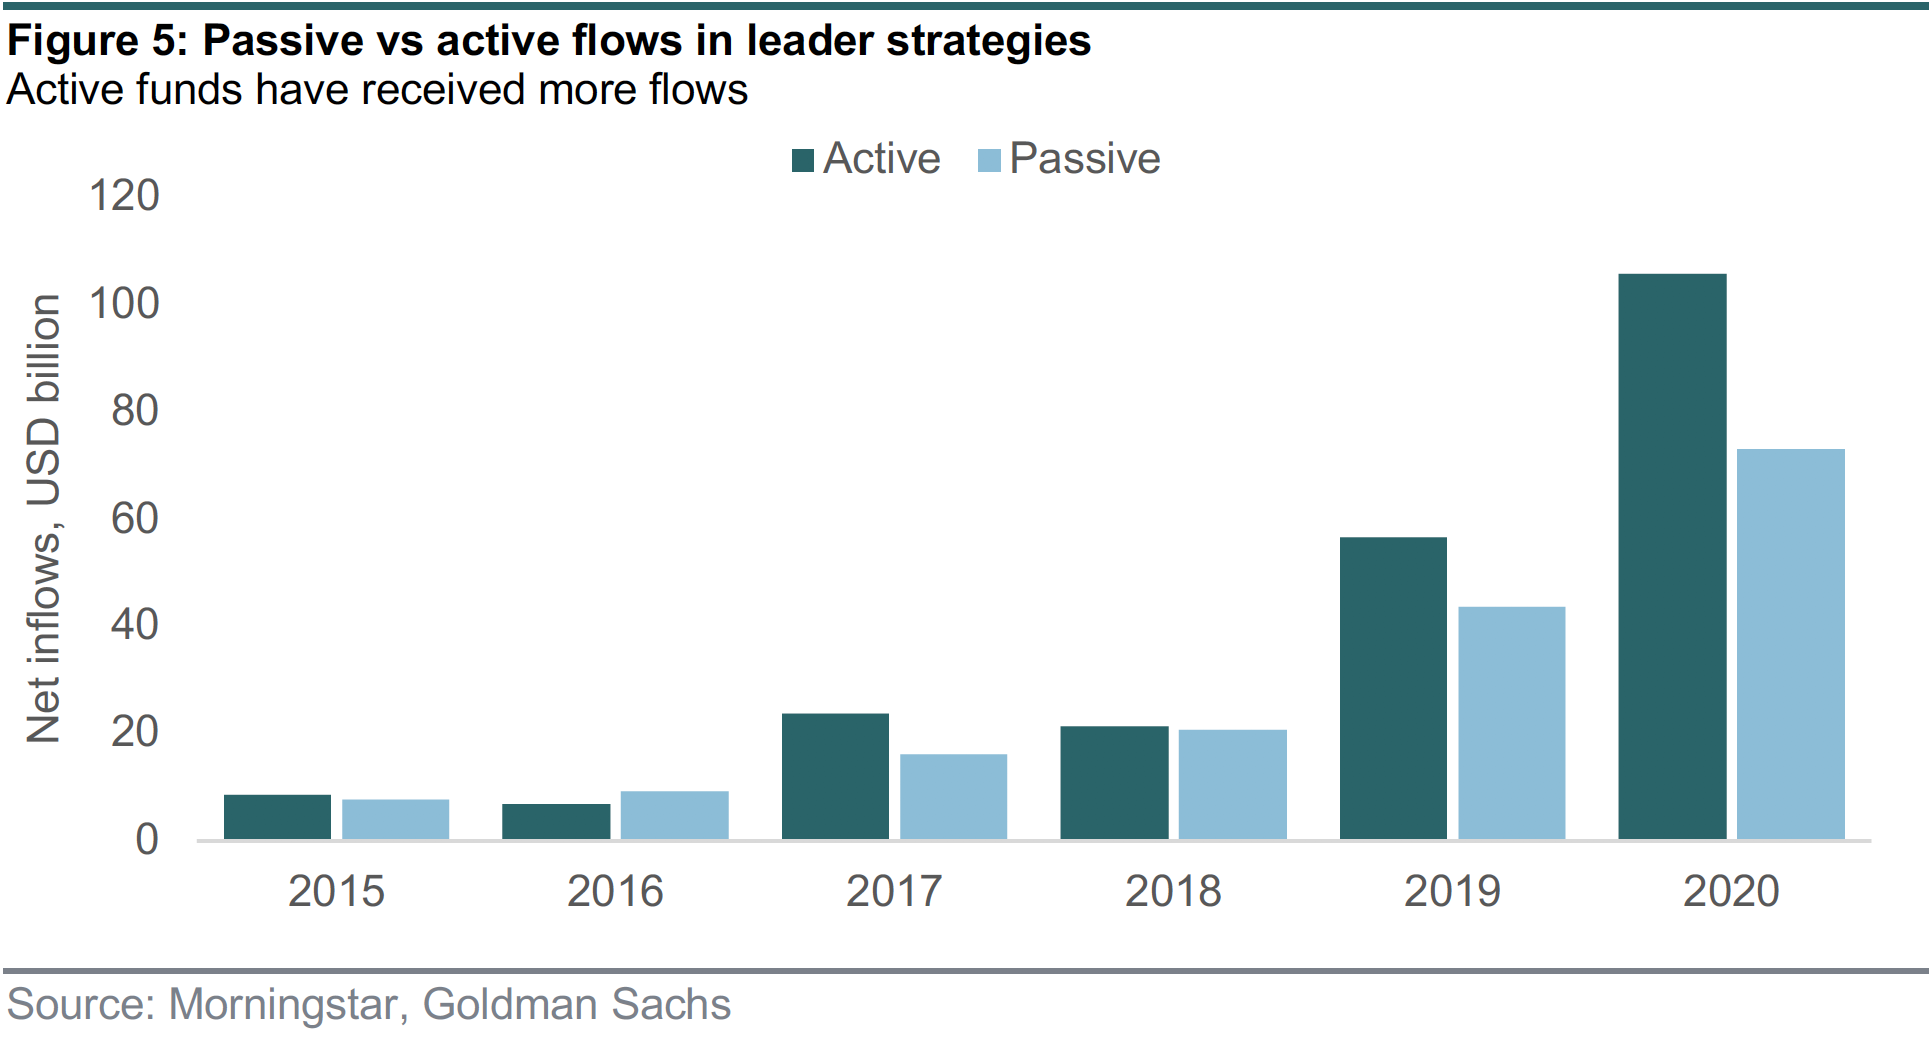
Passive leader strategies typically use quantitative ESG scores sourced from data providers such as MSCI or Sustainalytics. Drawbacks of passive leader strategies can be the lack of methodology transparency and correlation between provider scores, as well as the potential discrepancy between rule-based approaches and investor preferences. Active leader strategies can incorporate quantitative and/or qualitative ESG assessments. In recent years active funds have received more investor flows than their passive counterparts (figure 5).
How can one invest in leaders?
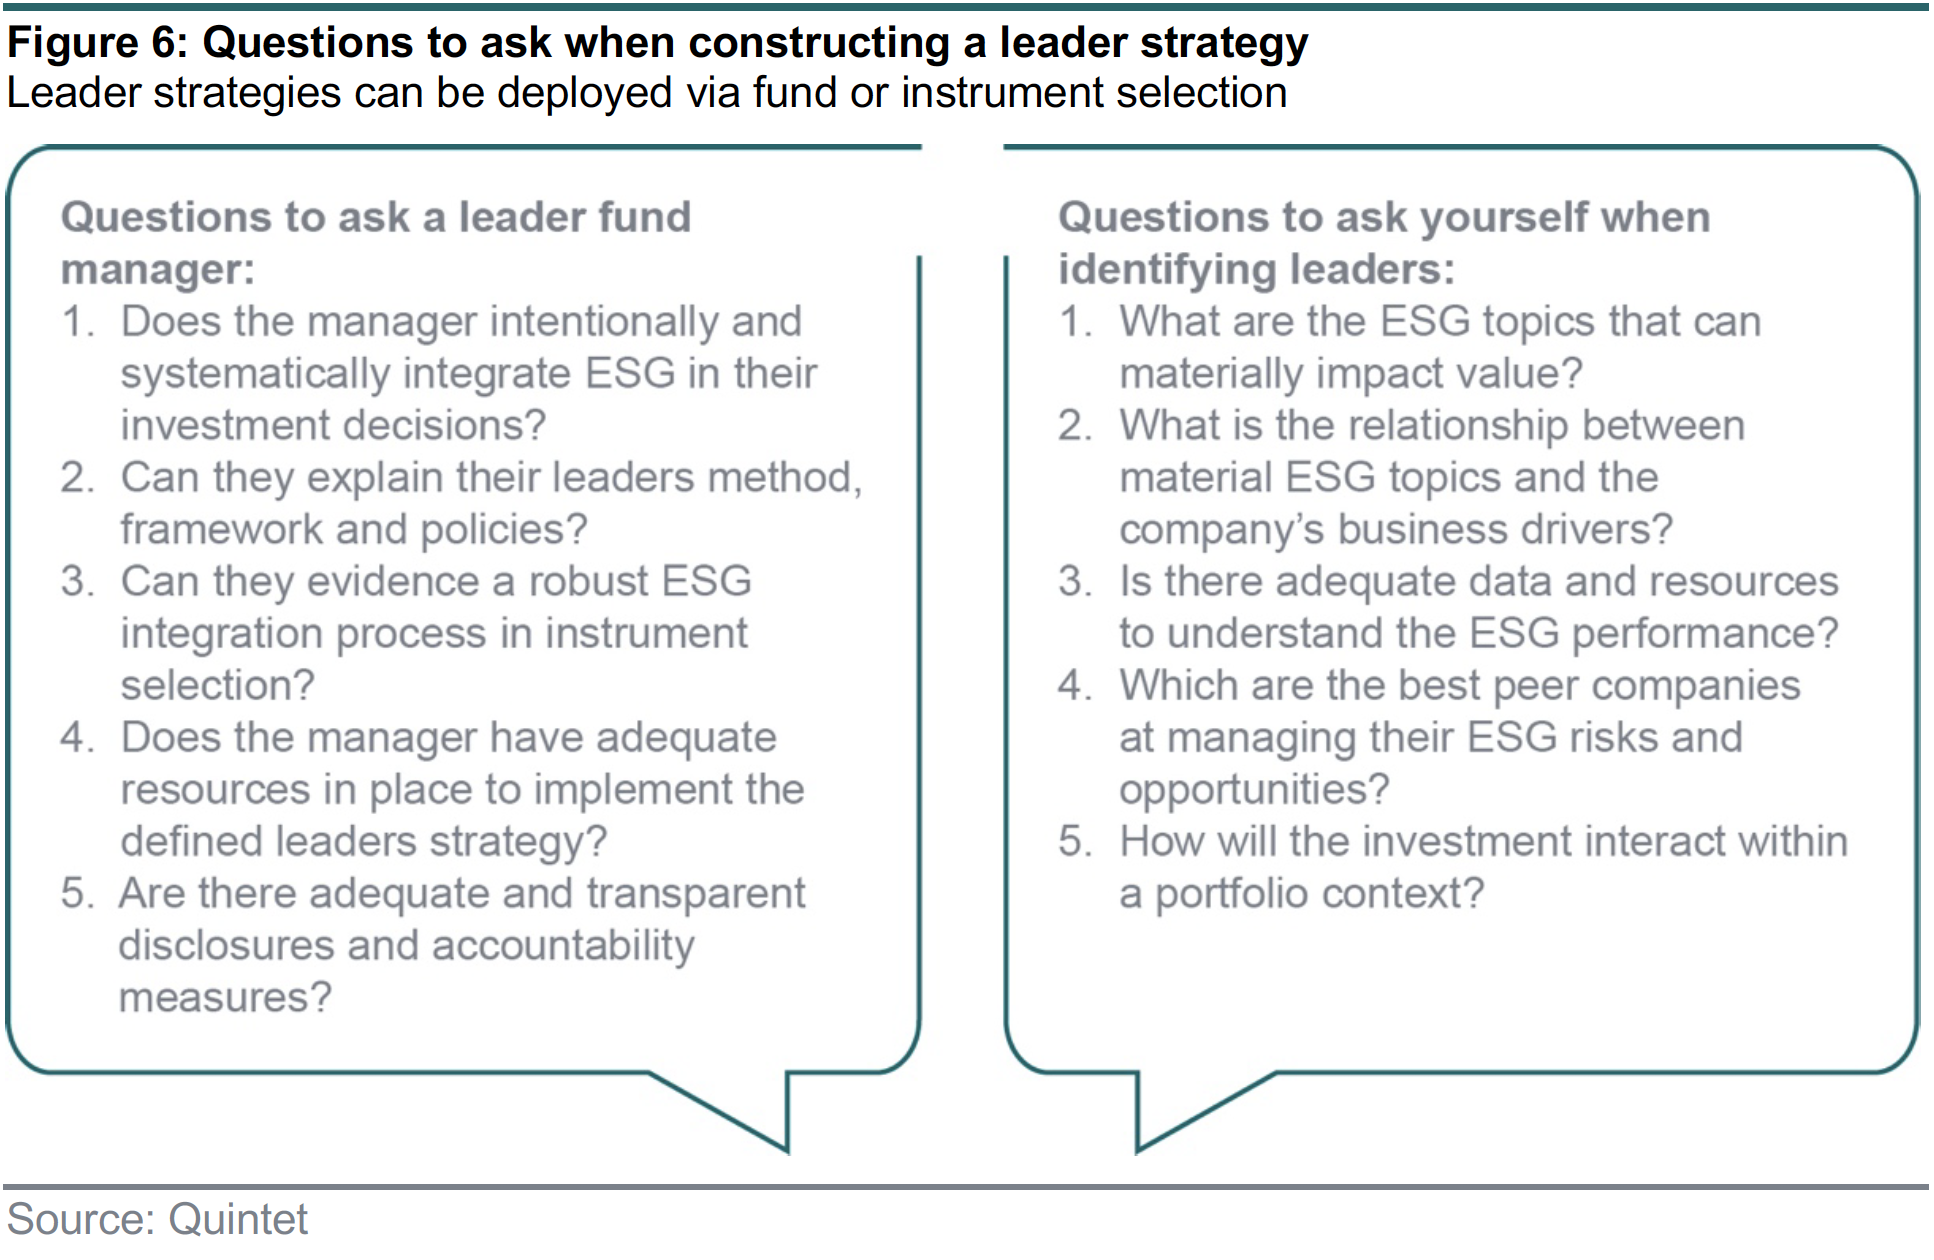
Leaders are an investment lens applicable to both equity and bonds. Leader strategies can be benchmarked to a conventional index such as MSCI World or Barclays Global Corporate Aggregate or a sustainable index such as MSCI World SRI. Investors can deploy leaders strategies in their portfolios via single instrument selection or fund selection (figure 6).
What are the key risks?
The risks of investing with a leaders lens mirror conventional risks such as credit, duration or equity.
However, there are some specific risks:
2 Friede, G., et al. (2015). ESG and financial performance: aggregated evidence from more than 2000 empirical studies. Journal of Sustainable Finance & Investment, 5 (4): 210-233.
3 Khan, M. et al. (2016). Corporate Sustainability First Evidence on Materiality. The accounting Review, 91 (6): 1697-1724.
4 Goldman Sachs (2020). Pricing ESG- assessing WACC, CROCI, and economic returns: 18
5 Giese, G et al. (2019). Foundations of ESG Investing: How ESG affects equity valuation, risk, and performance. The Journal of Portfolio Management, 45 (5): 69-83
6 Morningstar 2021 (https://www.morningstar.com/articles/1017056/sustainable-equity-funds-outperform-traditional-peers-in-2020)
The world surpassed 100 million confirmed cases of Covid-19 last week. However, there have been some improving signs in the US, where both new cases and hospitalisations have declined substantially in most states over the last two weeks. In Europe, Spain and France are still on an uncertain trajectory, while the situation is improving in Germany, Italy and the Netherlands.
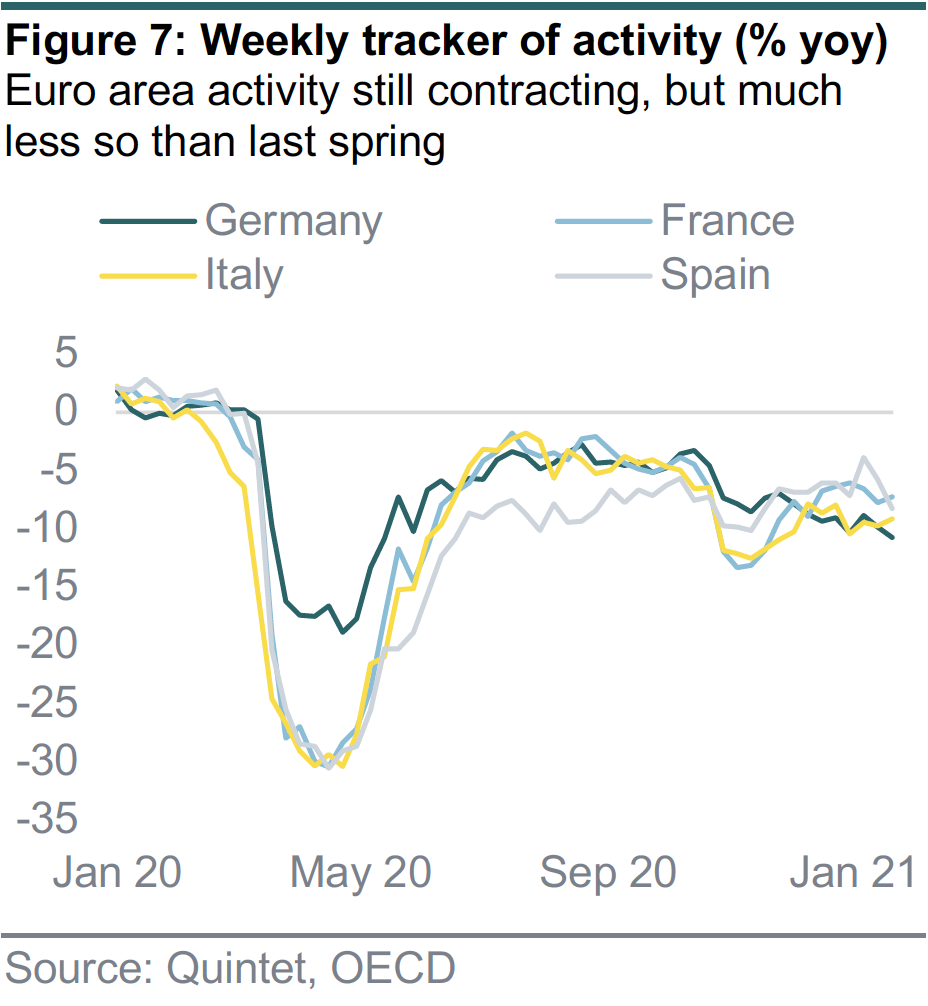
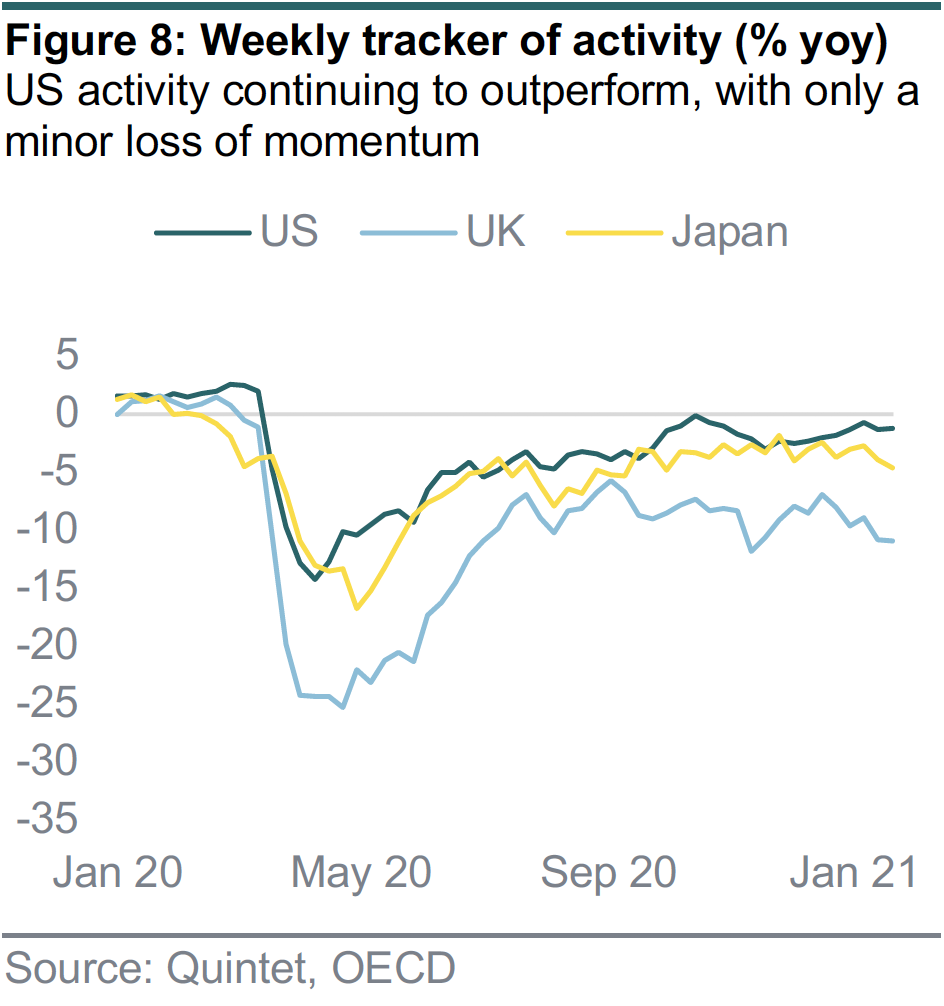
Economic activity remains constrained by government-imposed restrictions. The OECD’s weekly tracker of economic activity provides a real-time, high-frequency view on growth by combining machine learning and Google Trends data (figures 7 and 8). The model aggregates data on thousands of keywords, to extract information on consumption, labour markets and housing, to name but a few. Most importantly, the model has proven useful in predicting GDP growth in times of crisis (the global financial crisis, the euro crisis and now the pandemic).
Several conclusions can be drawn from the data, as shown in the charts below. First, the current situation is nowhere near as bad as in spring last year, despite significant restrictions currently in place, as businesses and consumers have adapted to this new normal. Second, most economies seem under less pressure than during the first wave – probably as employees have better adapted to remote working, retailers have shifted online to a greater extent, and deliveries and food takeaways are more widespread – and the US in particular appears to be resilient. Third, relative to other regions, activity in the euro area and UK seems to be impacted relatively more by lockdown extensions, with a further weakening most recently.
Our expectation is for a tough winter, followed by an improvement from this spring. Weakness in growth may persist for a while as vaccine rollouts gather steam. But as the most vulnerable parts of the population are eventually vaccinated, governments will be able to lift restrictions gradually, allowing the reopening of many activities – in one form or another – at some point in Q2. Fiscal and monetary policy also look set to align, providing ample stimulus in the months and quarters ahead.
In other Covid-19 news, Merck, the US drug giant, abandoned two vaccine programmes after efficacy data proved less promising than expected. Johnson & Johnson published data on its vaccine candidate at the end of last week. It intends to apply for an emergency-use authorisation by the FDA in early February and expects to have product available to ship shortly after.
.svg?ext=.svg)